Getting Fireballed: The Statistics
Last night, I sent an E-mail to John Gruber, who writes daringfireball.net, a blog mostly about Apple-related stuff but which ventures into political and Stanly Kurbick-related content occasionally. Interesting, really, especially given that he has made writing Daring Fireball his full-time job, paid for only by sponsorships. Enviable, yet… not so much. I like my job. To each his own.
Anyway, I wrote saying that I posted an entry on my blog about some new features—refinements, really—in MacOS X 10.6, “Snow Leopard.” I’ve sent him occasional updates like this, and I’ve always secretly hoped that he’d mention my blog on his blog. That way, I could experience “fame” in my own little way. He never has before.
So when he did mention my posting, I was pleasantly surprised, and I got what is known as “Fireballed.” That’s when a server gets swamped by people who check his website, see his link to mine, and click! my server gets a hit.
What’s “getting Fireballed” like? Perhaps some statistics are in order. I hear geeks love statistics. (I am a geek.)
I average 1000 visitors to my website per month. And I average about 100 requests per day. Not a whole lotta’ traffic. I might get three comments on material per year.
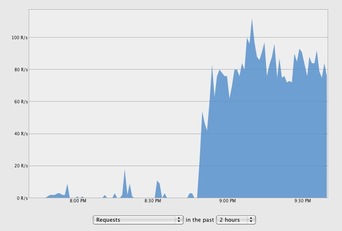
After John posted, I initially got 100 requests per second! In the 24 hours since, I have had 16,000 unique visitors, and 17,000 pageviews. Furthermore, I went from four to six Google Reader subscribers.
And five… five! comments in 24 hours! Now that’s somethin’! (Two on non-MacOS X-related content. Nifty, even if I disagree with them both.)
For the geeks among us, there are some interesting things that happened. First, the server had no trouble keeping up with demand—it’s running MacOS X Server 10.5, and it’s a dual PPC G5 with aspirations of being an eight-core Mac Pro. But it was most likely not stretched because my pipe, a normal, garden-variety AT&T DSL line, was very full. Nevertheless, Apache was pretty busy, having 1020+ workers serving (“/usr/sbin/httpd -D FOREGROUND”) pretty constantly.
Graphs? Yep, I have those, too.
Here’s what it looked like just after John posted his link. The unit on the left is “requests per second.” Notice that his post went live about 8:45pm. That’s when I noticed that things were getting a bit… slower… on… my… internet… connection…
(Click on any picture for a larger version.)
Nearly 24 hours later, we notice that most of the traffic has died down. There are some peaks where we woke up or got home from work or class. Or that’s my theory anyway. I pretty much expect it to bottom out at about now, 24 hours after he posted.
PowerPC G5’s or not, I noticed that it wasn’t even straining under the load (twin graphs on the right). Cool.
I also checked my Internet connection, but I don’t have a screenshot of it then. I do have one from now, though, and you can see what happens at about 8:45 last night. (I don’t ever try to explain these graphs. You have to figure them out for yourselves. Red, green, in, out…)
Data transferred? Glad you asked! Here’s what AWStats has to say about things.
7.5GB upstream at something not much more than 56kbps makes for some patient web viewers.
Now I’m going to send a link to this page to John for his info, but I think I’ll recommend that he not publish a link to it. :-)
Thanks to everybody who visited. And thanks to John Gruber for my 15ms of fame!


Hey Bill,
What are you using to produce all your graphs?
I used Server Admin for the web graphs, and IPcop and AWstats as noted for the others.
/Bill
Heh. Guess I'm one of your two new Google Reader subscribers. That's - weird.
Doesn't strike me as terribly surprising though, given that most of Gruber's readership is pretty vehemently opposed to conservatives.